技術開発室の馮 志聖(マイク)です。
corona virus is terrible.
And we need to understand how terrible it is.
The most easy way is use the map and take a look how many person get sick.
Almost corona virus data is base on country.
Like this map :
https://google.com/covid19-map/?hl=en
Issue
For each Country have huge area.
It is not easy to handle distribution of details.
I think it have a lot of person want to know about degree of diffusion.
For example I live in Yokohama city.
Yokohama city in Kanagawa Prefecture and Kanagawa Prefecture in Japan.
In the map base on Country I only can get the info from Japan.
I have no idea in my City how degree of diffusion is.
It have few data base on City or Prefecture.
Solution
This is information for corona virus.
It have many website show the information and many data analysis.
https://github.com/pomber/covid19
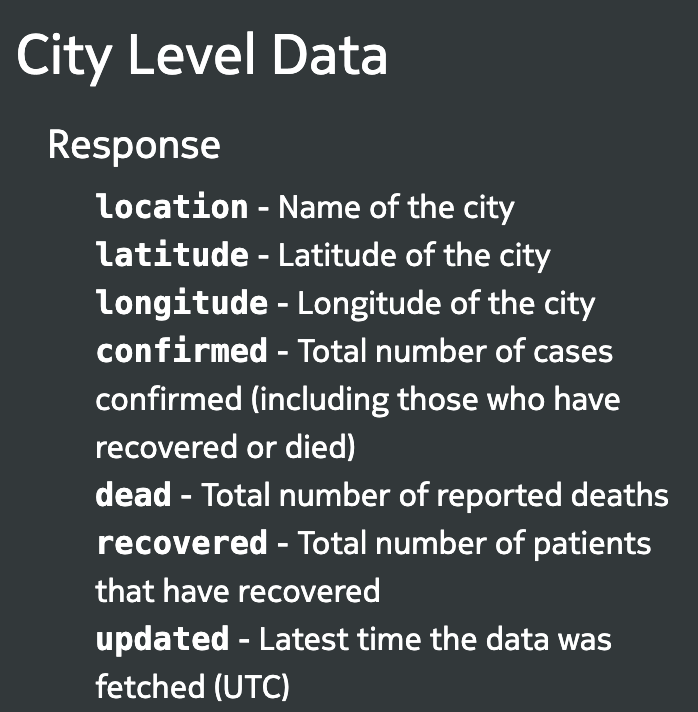
I find an API can list all city ,GPS ,person count.
Let's try to build the map for corona virus base on city.
Use free and fast way to build it.
Structure

It is small project.
And not need any strong server.
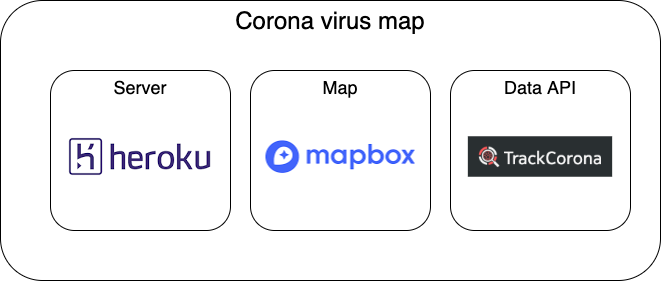
So I choose Heroku free plan to be a server.
Map
It have two popular free resource map tools.
1.Google map
2.Mapbox
And I choose mapbox to be map.
mapbox is powerful and lighter for all device.
Why I choose mapbox not google map?
The good points of google map.
1.The best information.
Thanks to Google’s satellites, Street View vehicles, and user-generated corrections, Google’s geographical coverage is considered the best.
2.Multiple style options.
The JSON-like syntax used by Google Maps is immediately loaded along with a map. You can manage the visibility, color, and opacity of all map elements.
3.Street View.
Street View is a feature that provides interactive panoramas from different positions along lots of streets around the world. This feature can visualize Keyhole Markup Language (KML) and GeoRSS data on the map.
4.Extensive language support.
Google Maps supports many languages.
5.Information support.
You can count on a large community and multiple developers providing support.
The bad points of google map.
1.Browser limitations.
The Google Maps JavaScript API doesn’t support all web browsers.
2.Tricky pricing.
The Google Maps pricing model is not easy to sort out. And this is the biggest catch.
3.First call.
Autocomplete makes a call for all letters typed in the search bar.
4.Second call.
Another API call is made when a location is selected.
5.Third call.
Directions are added to the nearest location.
6.Usage limitations.
The free plan for Google Maps is limited to 10 queries per second.
The good points of Mapbox.
1.Unique customization options.
Mapbox is more customizable than Google Maps.
2.Open-source SDKs.
Mapbox Maps SDKs are open-source. Mapbox shares their code on GitHub so it can always be seen, analyzed, and improved.
3.Integration with PubNub.
Mapbox partners with PubNub, which offers infrastructure-as-a-service for live data streaming, builds dynamic map visualizations from real-time data, and incorporates functionality like asset tracking, geocoding, and heatmaps.
4.Mapbox AR.
The Mapbox Maps SDK for Unity allows for building location-based experiences using points of interest (POIs) all over the world. You can add locations using drag-and-drop maps and POIs, 3D buildings and terrain, place-based AR, and more.
5.Offline maps.
There’s no offline mode with the Google Maps API. More precisely, offline mode is available in the branded Google Maps app.
The bad points of Mapbox.
1.Relatively weak coverage.
There are many places where Google has better coverage than OSM based services.
Reference
In this blog have detail info about google map vs mapbox.
https://yalantis.com/blog/mapbox-maps-ready-mobile-apps/
Data API
Data API is come from trackcorona.
https://www.trackcorona.live/api
They already have map and data analysis.
But I want simple and customize.
Task
First I try to analysis the API response and find out the key and data format.
https://www.trackcorona.live/api
Second I try to read mapbox document and use example to customize.
I choose this example to be map UI.
https://docs.mapbox.com/mapbox-gl-js/example/cluster-html/
In this example circle only have one number.
But data have other data need to show it.
So I choose popup on click example to show the info.
https://docs.mapbox.com/mapbox-gl-js/example/popup-on-click/
Third when I use mapbox it need geojson format datasource.
I use this library to convert it.
GitHub - caseycesari/GeoJSON.js: Turn your geo data into GeoJSON. For Node.js and the browser.
Fourth I try to add chart in the popup but it not show all the area.
Then I use this example for fix this issue.
https://docs.mapbox.com/mapbox-gl-js/example/center-on-symbol/
Fifth use the most sample way to show the chart.
I use SVG and regist new element and create it.
Sixth it have update time need to compare.
I use moment.js to compare the UTC date and time.
Seventh I try to deploy it to Heroku.
I use the most sample php buildpack to build it.
https://devcenter.heroku.com/categories/php-support
At last when load the website on heroku website it will have issue.
Because of document.registerElement is not a function.
I use this library to solve the issue.
https://github.com/WebReflection/document-register-element
Final
I success build the corona virus map base on city.
This website is build by myself.
https://test-web-gyo.herokuapp.com/corona_virus/map.html
In this case I learning how to put the data on the map and show it.
mapbox have many API and many function can use.
And mapbox is light map for all device.
